Climate change data: machine learning project + data visualisation
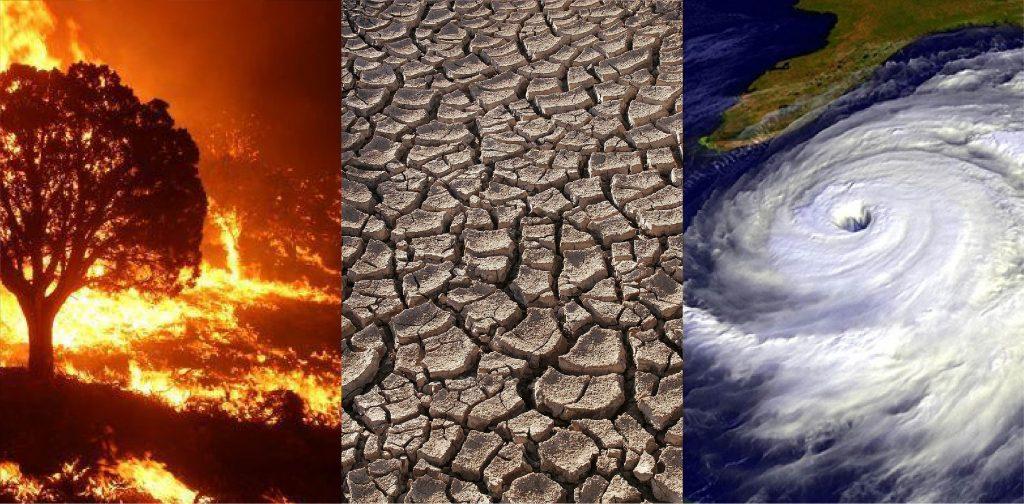
For my first machine learning (ML) project, which I completed during the last four weeks of my time at La Fosse after studying ML principles, my interest in climate change led me to focus on a dataset from Kaggle showing climate data for fifteen countries (Argentina, Australia, Brazil, Canada, China, France, Germany, India, Indonesia, Mexico, Japan, Russia, South Africa, the UK, and the USA) from 2000-2024.
The dataset can be viewed here, and is a relatively small one at <100 MB. This was due to time constraints (I had only a day and a half to complete the project) and my limited understanding of basic ML techniques. However, now that I have completed this project, I plan to complete an expanded ML project on climate change, utilising a significantly bigger dataset from the World Bank on climate change, as well as increased knowledge on my part of ML techniques, to provide a more comprehensive picture of the effects of climate change globally. Once it is fully completed, I will replace this project with it.
Information on Data:
- Title: Climate Change Dataset – “Dataset of Temperature, Emissions, and Environmental Trends (2000-2024)”
- File Size: 53.21kB – 90kB (depending on encoding)
- Number of Rows: 1000
- Number of Columns: 10
- Column names:
o Year
o Country
o Avg Temperature (°C)
o CO2 Emissions (Tons/Capita)
o Sea Level Rise (mm)
o Rainfall (mm)
o Population
o Renewable Energy (%)
o Extreme Weather Events
o Forest Area (%)
- Column names:
Analysis Questions:
- Does the data show that the combined average temperatures of the thirteen countries in the data have risen overall throughout the last 25 years (approx)?
- Can rising global temperatures be correlated with rising CO2 emissions per capita?
- Has there been an inexorable increase in sea level rise throughout the world?
- Has there been an increase in extreme weather over the past 25 years?
- Can relationships be established between a countries’ renewable energy program and forest area (both %), on the one hand, and average temperature, sea level rise, and extreme weather events on the other?
Hypotheses:
- Countries throughout the world have seen a general rise in temperatures overall.
- Rising global temperatures can be correlated with the trend for increasing CO2 emissions per capita – despite attempts by countries and organisations to bring down CO2 levels.
Which column will be my target variable for Machine Learning:
- Avg Temperature (°C)
Summary of cleaning and transforming data:
- I ensured, via regular expressions, that the measurements in the column titles (e.g., °C) were removed and the titles were converted to lowercase, with underscores added. This made for better-formatted titles. I also dropped the Population column, as it was not essential to the project; additionally, the figures in the column were noticeably incorrect.
- I ensured that columns with floats were formatted to two decimal places, to preserve precision from original calculations (in climate change studies, small differences can be meaningful when looking at long-term trends).
- I ordered the dataset by country and years (A-Z and 2000-2024, respectively).
Machine Learning
I used DataBricks to host this project, and utilised scikit-learn to create a basic regression model.
Steps:
- Split data into train/test sets
- Choose a simple model
- Train and evaluate the model
- Show accuracy score, R², or other relevant metrics
- Interpret the results
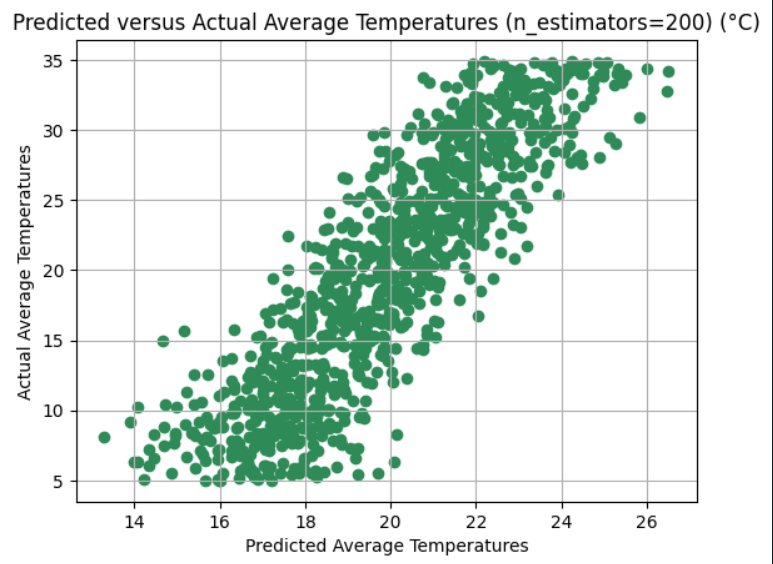
I used a RandomForestRegressor as an interesting contrast to previously learning KNeighborsRegressor. I also used GridSearchCV, which gave my data a model (or pipeline) and a grid of parameter values to try. GridSearchCV trained and validated each parameter combo using K-foldCV.
The results of my tests on my data led to the following outputs:
- Mean Absolute Error: 7.74 °C
- Mean Squared Error: 83.40 °C^2
- Root Mean Squared Error: 9.13 °C
- R2: -0.14
Summary of Results and Predictions after looking at data:
- Hypothesis 1: Countries throughout the world have seen a general rise in temperatures overall.
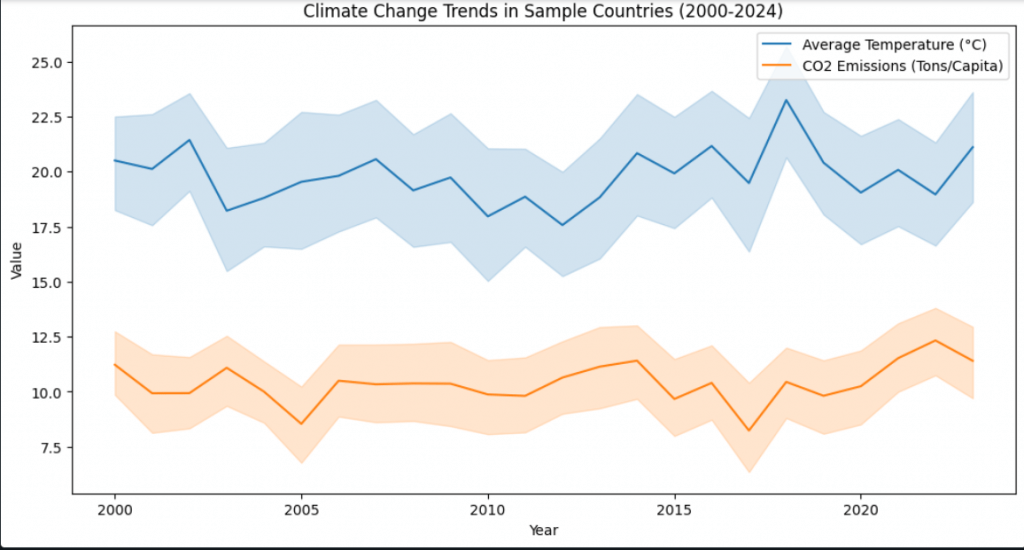
- The Data Visualisation of the processed data shows that the combined average temperatures of the fifteen countries in the data have indeed risen overall throughout the last 25 years.
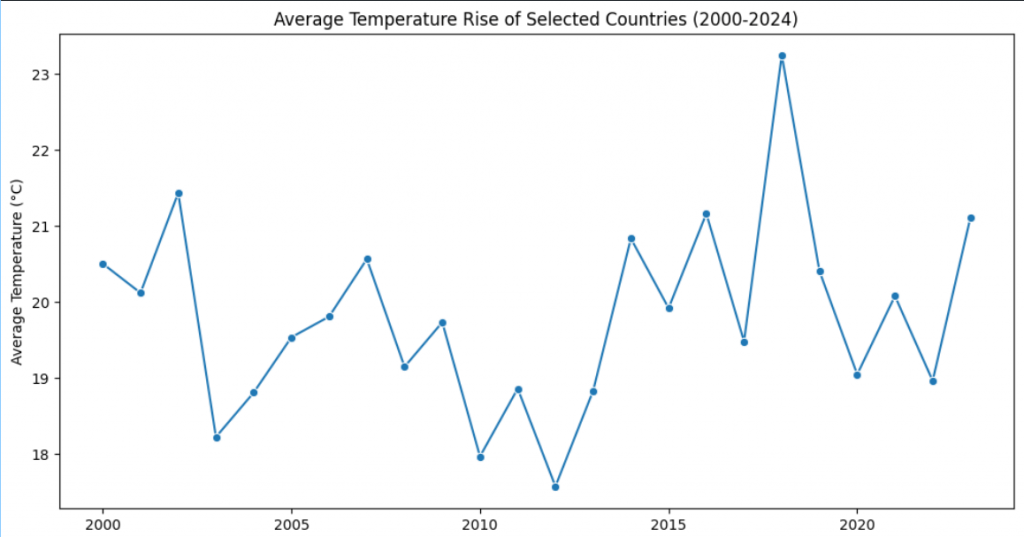
- The results of my ML appear to bear this out when n_estimators = 200:
- However, after splitting data into train/test sets, a more unclear picture emerges:
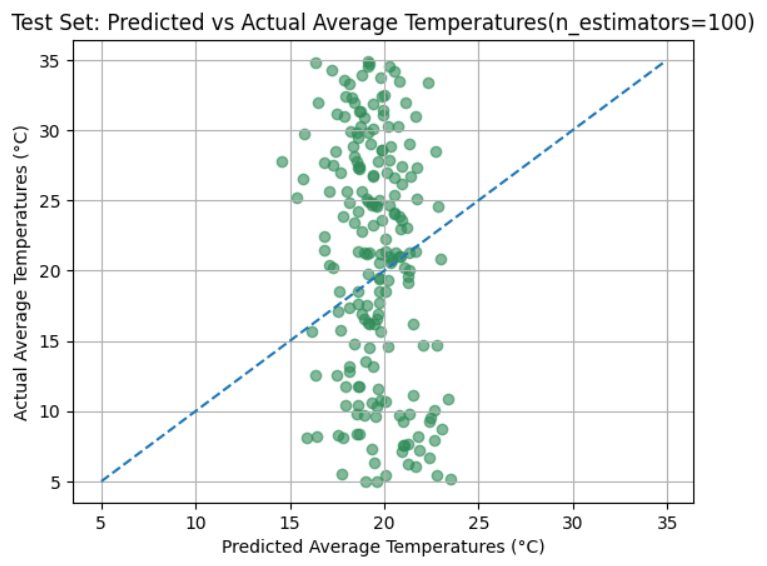
- Despite this, the data and the majority of ML predictions alike do ultimately show that the fifteen countries have seen an increase in temperatures.
- Hypothesis 2: Rising global temperatures can be correlated with the trend for increasing CO2 emissions per capita – despite attempts by countries and organisations to bring down CO2 levels.
- This hypothesis is true when looking at the data visualisation of the processed data:
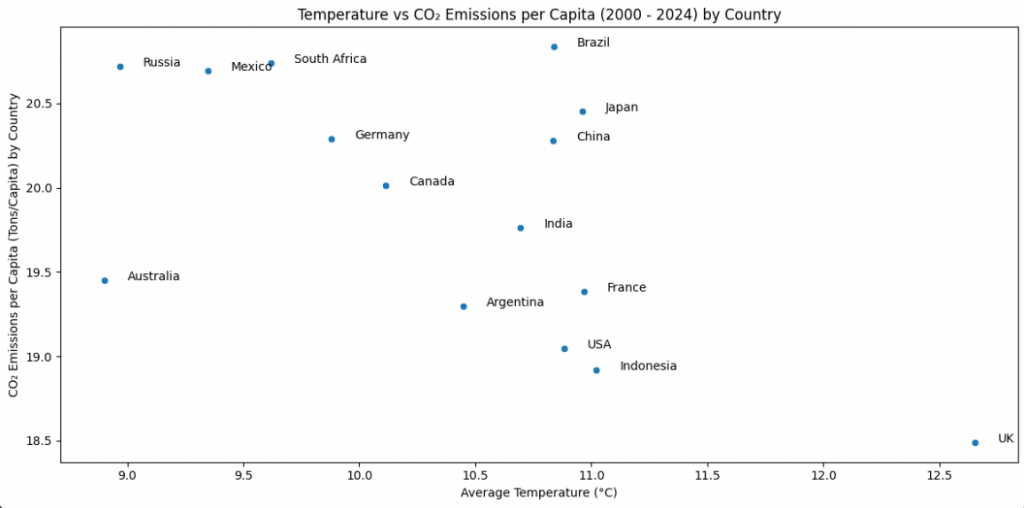
- However, the picture becomes much more complicated and unclear at the country level:
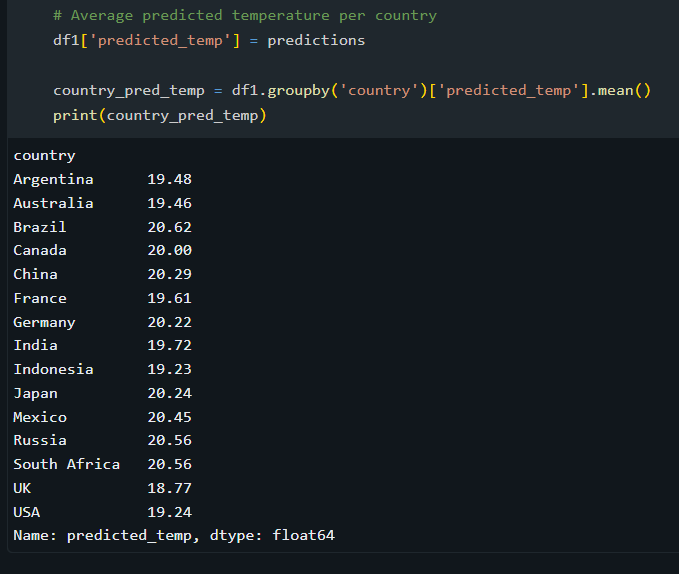
- My ML processing did produce basic predictions for average temperatures in the countries in the dataset. However, this was before fine-tuning the ML models. I did not have time to compare the ML predictions with reality (as of 2024, the most recent year in the data), nor to predict future events.
Conclusion
While it is difficult initially to interpret the data that my ML models have produced, the overall conclusion to gain from the data and the ML processing of that data is that average temperatures have risen overall when taking into account the countries in the dataset, and will continue to rise. However, isolating data for each country is difficult, given that weather patterns exist regardless of international borders. It is at the macro level (all the countries in the dataset combined) that the average temperature rise is clearest.
Thank you for reading.