StreetSafe
View StreetSafe website
View GitHub repository (client)
View GitHub repository (server)
StreetSafe project PowerPoint presentation
For the second of the two big projects that I completed at La Fosse (the first being VivaLingo), I consolidated my knowledge gained from both the data-focused last four weeks at La Fosse, together with the more general software development knowledge gained from the first four weeks of the course, in the form of a Minimum Viable Product (MVP) called StreetSafe. As with VivaLingo, it returned to my core interest of Tech for Better – technology that can inspire a positive social impact.
")
")
Once again as part of a team of four, I helped produce a mobile-first MVP that showed crime data visualisation in the UK based on area; signposted emergency services information; facilitated safe route planning; and provided educational resources to help users stay informed about local safety conditions in their area, turning awareness into prevention.
")
")
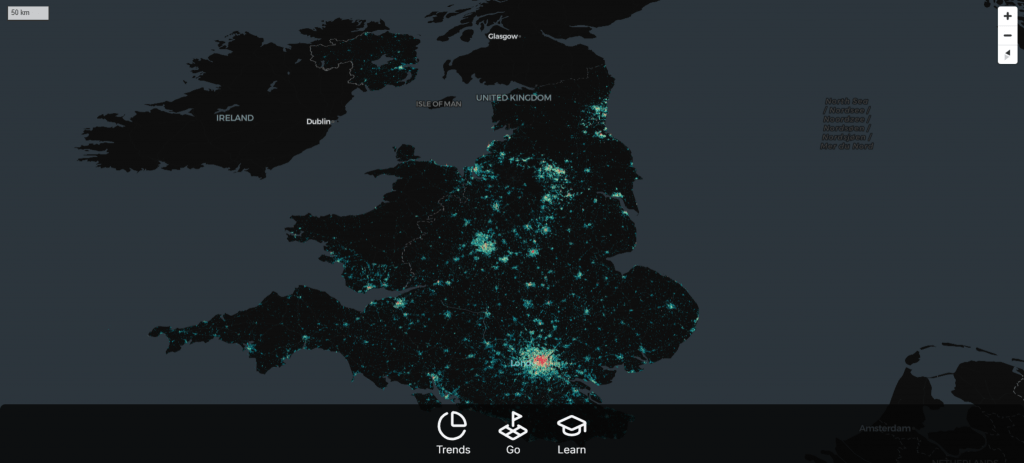
Most UK crime data is buried in difficult-to-read datasets or convoluted dashboards that few people use. StreetSafe aimed to counter this by offering a simple visual tool that mapped crime. In order to facilitate this, StreetSafe provides geospatial crime analytics using H3 hexagonal indexing for precise location-based queries. The user is able to enter their location details and see crime data about their area. Our app maps crime incidents in visually appealing data visualisations; shows crime trends in clear graphs; offers tailored prevention resources; and builds the safest route from A to B. In so doing, we hoped to provide an MVP that facilitates greater safety, transparency, and education that could help people avoid risk and make smarter choices.
")
Preparation
As part of the process of designing the MVP, and in a similar manner to the VivaLingo project at La Fosse, as well as my work at Founders & Coders, we planned the structure using an Agile methodology, including setting up a Trello board and creating wireframes and user flow diagrams.
Once again, as with VivaLingo, I also visualised the database structure with an Entity Relationship Diagram generated using Mermaid.js:


Meanwhile, we brainstormed stakeholder analysis stories and risk assessment, to try and think about who would be interested in the app, and what risks could be entailed:


We also applied a model-view-controller (MVC) architecture in our codebase, and additionally implemented authentication. In addition, we developed a large amount of API endpoints, which can be viewed in the technical specification below.
Core Features and Challenges
This was a large and complex project, requiring effective communication as a team. We utilised a vast UK-wide raw dataset on crime data from the police, which broke down crimes into the following categories:
- Burglary
- Personal Theft
- Weapon Crime
- Bicycle Theft
- Damage
- Robbery
- Shoplifting
- Violent Crime
- Antisocial
- Drugs
- Vehicle Crime
Moreover, the project involved separating the MVP into two different GitHub repositories: one for the server (the backend), and one for the client (the frontend); naturally, the two repos had to interact with each other in order for the MVP’s functionality to work. My role, once again after VivaLingo, was principally frontend, including ensuring that map functionality worked; however, to dynamically retrieve the data that is used in our visualisations, I had to ensure that my work was linked up sufficiently to the backend, thus requiring knowledge of the backend structure and code, including API endpoints, and of how it needed to be connected to the frontend.
For our indexing map of the UK, we used MapLibre GL with react-map-gl (with some Mapbox functionality), over which we overlaid the H3 geospatial indexing system for location mapping, which essentially splits the world up into grid hexagons and stores locations in 1D, thus saving space.

In order to work out a street route in the three modes – either Direct (simply the quickest route from A to B), Informed (somewhat cautious based on crime statistics in the area when planning A to B), or Cautious (very cautious based on crime statistics in the area) – the project employed Valhalla (whose GitHub repository somewhat inevitably contains many folders suitably named after Viking/Norse Gods), which helped facilitate open-source routing for use with OpenStreetMap data.
")
")
The charts were delivered via Chart.js with react-chartjs-2.
Together with testing the frontend using ViTest, as a result of using Vite as our build tool, my work on this project represented a steep learning curve and challenge, given that I had not used many of these programs before (except for React and Tailwind CSS). Consequently, I had to consult the documentation regularly to understand the required syntax. I was ultimately able to deliver the required code through hard work and force of will.

Meanwhile, in order for such a large dataset underpinning the project to display promptly in user interactions with the app, my project colleague worked in C# microservice on the backend, involving the preprocessing and caching of data, to facilitate this, as well as storing in Neon (Postgres-compatible serverless DB). The backend code also includes some C++ and NUnit3 testing.
For deployment, we used Docker, which helped automate the containerisation of the different languages (JavaScript/React, TypeScript, C#, C++, SQL, etc.) so that the application could work efficiently.
Aside from the complex technical challenges involved with this project, it is important to accentuate that the purpose of the MVP was and is not to point the finger at certain areas which have a higher-than-usual crime rate, or to stigmatise these areas. That is not the purpose of the MVP. The MVP was designed to be an easy visual tool that could show crime data in an area; that could show safe routes through an area; that could signpost emergency services; and which could provide resources for the user that could be used to empower the individual in turning awareness into prevention.
If the MVP were ever turned into a full commercial app, it could be crucial in saving lives. Such a thing will always be valuable in the face of crime on our streets.
Technical Information
Tech Stack for streetsafe-client:
- Frontend: React 19 with React Router 7
- Styling: Tailwind CSS with custom theme
- Maps: MapLibre GL with react-map-gl
- Charts: Chart.js with react-chartjs-2
- Icons: Lucide React
- Testing: Vitest with browser testing
- Build Tool: Vite
Tech Stack for streetsafe-server:
- Backend: Node.js, Express.js
- Database: PostgreSQL with H3 extension for geospatial operations
- Authentication: JSON Web Tokens (JWT)
- Testing: Jest with comprehensive unit tests (80%+ coverage)
- Geolocation: H3 hexagonal indexing, Nominatim geocoding
- Data Processing: CSV import tools for emergency services data
Database Schema:
Core Tables –
- users – User authentication and profiles
- crime_areas – Crime statistics with H3 geospatial indexing
- educational_resources – Crime prevention and safety resources
- emergency_services – Police, hospital, and fire service locations
Running project:
To run the project, first run streetsafe-server, and then streetsafe-client:
Getting Started
Prerequisites:
- Node.js (v18+ recommended)
- PostgreSQL (v13+) with H3 extension installed
- Environment variables configured in .env file
Installation:
- Clone the streetsafe-server repository
- cd streetsafe-server
Install dependencies:
npm install
Set up environment variables:
create .env file
.env with your database connection details, port, jwt_secret, and node_env
Database Setup:
Create database schema and seed educational resources
npm run setup-db
Import emergency services data from CSV files:
npm run import
Running the Server:
Production mode
npm start
Development mode with auto-reload:
npm run dev
Server runs on http://localhost:3000 (or PORT from .env)
Testing:
Run all tests with npm test
Run tests with coverage report with npm run test:coverage
Run specific test file with npm test graphsTests.js
API Endpoints
Authentication (/api/auth):
POST /api/auth/register # Register new user
POST /api/auth/login # User login
POST /api/auth/logout # User logout
GET /api/auth/profile # Get user profile (Protected)
Crime Analytics (/api/graphs):
GET /api/graphs/totals # Crime totals by category (bar chart)
GET /api/graphs/trends # Crime trends over time (line chart)
GET /api/graphs/proportions # Crime proportions (pie chart)
GET /api/graphs/locations # Available H3 locations
GET /api/graphs/dates # Available date range
GET /api/graphs/crime-types # Supported crime categories
**Query Parameters:**
– ‘startDate’, ‘endDate’ – Date range filtering (YYYY-MM-DD)
– ‘location’ – Natural language location (e.g., “London”, “Manchester”)
– ‘radius’ – Search radius in kilometers (default: 3km)
– ‘crimeTypes’ – Comma-separated crime types for filtering
– ‘groupBy’ – Time grouping: “month” or “year” (trends only)
Map Data (/api/map):
GET /api/map/features # All crime data for map hexagons
GET /api/map/hex/:h3Index # Specific hexagon data with emergency services
Educational Resources (/api/educational):
GET /api/educational/resources?crimeTypes=burglary,violent # Crime prevention resources – filter by crime types
Emergency Services (/api/emerg-services):
GET /api/emerg-services/closest?h3Index=123456789 # Find nearest emergency services – H3 location index
Configuration:
Environment Variables (.env)
# Database: DB_URL=postgresql://user:password@localhost:5432/streetsafe
Authentication:
JWT_SECRET=your-secret-key-here
JWT_EXPIRES_IN=24h
Server:
PORT=3000
NODE_ENV=development
Then run streetsafe-server:
- Clone the streetsafe-server repository
- cd streetsafe-client
Run npm install to run all dependencies
Start the development server using npm run dev
The application will be available at http://localhost:5173
Environment Setup
The application expects an API server running at –
- Development: http://localhost:3000/api
- Production: /api
Available Scripts
- npm run dev – Start development server with HMR
- npm run build – Create production build
- npm run start – Start production server
- npm run test – Run test suite
- npm run coverage – Generate test coverage report
Testing
The project uses Vitest for testing with browser-based testing capabilities:
Docker Deployment:
Build and run using Docker –
docker build -t streetsafe-client .
docker run -p 3000:3000 streetsafe-client
Production Build
Create a production build:
npm run build
Deploy the contents of the build/directory to your hosting platform.